Drone and crawler ingestion
Imagery and video from aerial and in-line platforms with flight and telemetry logs preserved.
From a single inspection to longitudinal asset integrity.
A vision system that detects and localises pipeline deterioration, then tracks each defect across inspection cycles so maintenance is prioritised by progression rather than by appearance.
01 · The problem
Drone and crawler inspections generated terabytes of imagery per campaign. Analysts reviewed it, wrote a report, and filed it. The next campaign started from scratch.
This meant the single most useful fact about a defect was unavailable: whether it was getting worse. A stable twenty-year-old corrosion patch and a crack that had doubled since spring looked identical in a report that only described the present.
02 · What we did
We made identity across time the core problem. Defects are localised to real-world coordinates on the asset, so the same physical flaw is recognised as the same entity across campaigns even when captured from a different angle, altitude and light.
Once a defect has a history, prioritisation changes completely. The system ranks by rate of change and projected time-to-threshold rather than by current severity, which is what an integrity engineer actually needs to schedule work.
A defect without a history is a photograph. With one, it is a forecast.
Two of the screens that carry the most weight in daily use, rebuilt here from the production design system.
A defect with a history is a forecastThe same physical flaw is matched across campaigns, so ranking is driven by growth rate rather than present appearance.
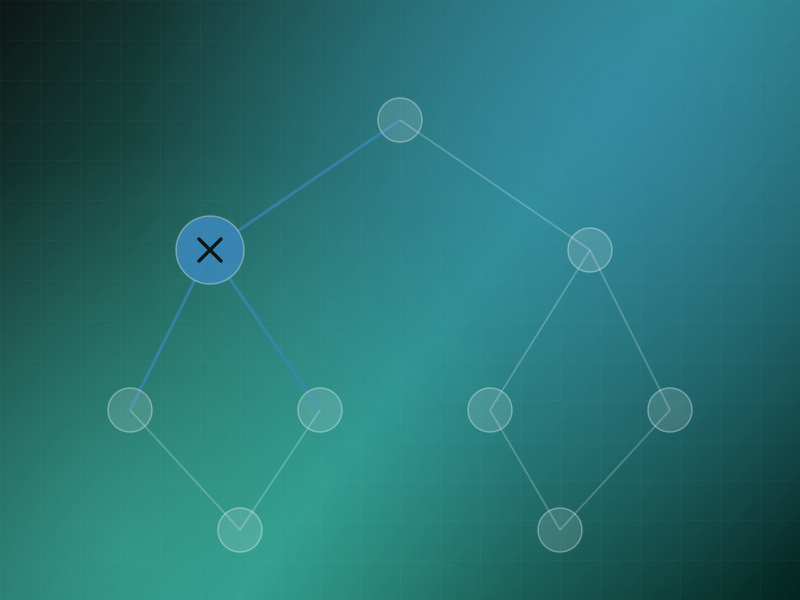
Findings sit in physical spaceEvery detection is positioned on the asset rather than in a frame, which is what makes cross-campaign identity possible.
Grouped by the job each set of capabilities exists to do, rather than by which team built it.
Imagery and video from aerial and in-line platforms with flight and telemetry logs preserved.
Frames registered against the asset model so every pixel has a position on the pipeline.
Blur, exposure and coverage gaps flagged during the campaign while the crew is still on site.
Crews confirm coverage and mark points of interest before leaving the location.
Segmentation models trained per surface and coating type, since a coated line and bare steel behave differently.
Defect extent estimated in physical units using capture geometry rather than reported in pixels.
Findings typed against the client's integrity taxonomy so they map onto existing procedures.
Low-confidence detections routed to analyst review instead of entering the record unflagged.
Each defect matched to prior campaigns by position and shape signature, with the match evidence shown.
Growth rate computed per defect across the full inspection history.
Projected date at which a defect reaches an intervention threshold, with uncertainty stated.
A work list ordered by projected risk and access cost rather than by current appearance.
Layer by layer, with the reason each one exists, because the reason is usually the interesting part.
Bulk campaign upload with automatic association of imagery to telemetry and asset segment.
Photogrammetric alignment of frames to the asset model producing per-detection world coordinates.
Segmentation and classification per surface class with calibrated confidence outputs.
Cross-campaign defect matching on position, shape descriptor and surrounding context.
Map-based workspace with defect history, progression charts and the prioritised work list.
Technology
Measured against how the operation ran before, not against a benchmark chosen after the fact.
Inspections stopped being disposable. Each campaign now adds to a defect history instead of replacing the last report.
Prioritisation is based on movement. Engineers schedule against growth rate and projected thresholds.
Coverage gaps are caught on site. Quality gating happens while the crew can still re-fly a section.
Findings sit in physical space. Every defect has coordinates on the asset, not a frame number.
How it ran
Assessed historical campaigns and mapped the client integrity taxonomy onto model outputs.
Built geospatial registration first, because cross-campaign identity depends on it entirely.
Per-surface segmentation with confidence calibration and analyst review routing.
Cross-campaign matching, growth computation and threshold projection.
Map workspace, prioritised work list and integration with the maintenance system.
From defect detection to defect causality.
A multimodal system that correlates line video, machine telemetry, batch records and operator actions to explain why a defect happened, not merely that it did..
Not alarm detection. Failure hypothesis reduction.
A correlation engine that turns an alarm storm into a short ranked list of probable root causes by reasoning over network topology and fault propagation rather than alarm counts..
From deviation to evidence, with the audit trail intact.
A deviation investigation assistant that assembles batch records, equipment telemetry, inspection imagery, SOPs and historical deviations into an evidence-linked case file a quality unit can defend to a regulator..
Tell us what you run. We will get back to you as soon as possible with what we would build for your situation and, just as usefully, what we would leave out.